Crear gráficas accesibles con jQuery y canvas

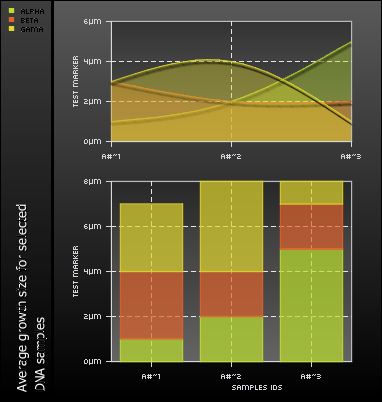
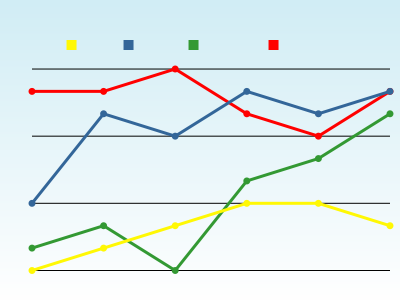
Buen plugin para jQuery que permite crear gráficas de datos accesibles mediante canvas. El script es bastante fácil de usar, se crea una tabla (sí, si, con <table>, que es para lo que se deben usar), y el script dibuja los datos en un canvas.
Ofrece la posibilidad de crear gráficas de pie, barras y líneas, para lo cual, en el class de la etiqueta canvas hay que especificar el origen y el tipo de gráfica (por ejemplo, fgCharting_src-dataTable_type-pie).
Creating accessible charts using canvas and jQuery
Vía / couch

Realizar gráficas con MySQL y Google Graph

Buen ejemplo para obtener la URL que nos dibuja gráficas usando Google Graph mediante procedimientos almacenados de MySQL. Está sacado de este ejemplo, que a su vez está sacado de este otro para Oracle.

DELIMITER $$
DROP FUNCTION IF EXISTS `dm_midas`.`FNC_GOOGRAPH_DB_SIZE`$$
CREATE FUNCTION `dm_midas`.`FNC_GOOGRAPH_DB_SIZE` (
p_chart_type CHAR,
p_height INT,
p_width INT) RETURNS varchar(3000) CHARSET latin1
READS SQL DATA
BEGIN
/* Author:    Walter Heck - OlinData */
/* Date:      20090216 */
/* Note:      After an idea by Alex Gorbachev - Pythian */
/*            http://www.pythian.com/blogs/1490/google-charts-for-dba-tablespaces-allocation */
/* variable declaration */
DECLARE v_done BOOLEAN default false;
DECLARE v_url varchar(3000);
DECLARE v_schema_name varchar(3000);
DECLARE v_data_length_sum int;
DECLARE v_data_length_total int;
DECLARE v_legend_labels varchar(3000);
DECLARE v_chart_labels varchar(3000);
DECLARE v_chart_data varchar(3000);
/* Cursor declaration */
DECLARE c_schema_sizes cursor for
select
t.table_schema,
round(sum(t.data_length + t.index_length) / 1024 / 1024) as data_length_schema
from
information_schema.tables t
group by
t.table_schema
order by
t.table_schema;
/* Handler declaration */
DECLARE CONTINUE HANDLER FOR NOT FOUND SET v_done = true;
/* Initialize the variables */
SET v_legend_labels = '';
SET v_chart_labels = '';
SET v_chart_data = '';
/* Get the total data length + index_length for all tables */
select
round(sum(t.data_length + t.index_length) / 1024 / 1024) as data_length_total
into
v_data_length_total
from
information_schema.tables t;
/* Open the cursor */
OPEN c_schema_sizes;
/* Loop through the cursor */
get_data: LOOP
/* Fetch the next row of data into our variables */
FETCH c_schema_sizes INTO v_schema_name, v_data_length_sum;
/* if there is no more data, v_done will be true */
IF v_done THEN
/* Exit the loop */
LEAVE get_data;
END IF;
/* Add the schema name to the labels for the legend */
IF v_legend_labels = '' THEN
SET v_legend_labels = v_schema_name;
ELSE
SET v_legend_labels = concat(v_legend_labels, '|', v_schema_name);
END IF;
/* Add the total size of the schema to the labels */
IF v_chart_labels = '' THEN
SET v_chart_labels = v_data_length_sum;
ELSE
SET v_chart_labels = concat(v_chart_labels, '|', v_data_length_sum);
END IF;
/* Get the percentage of the total size as the graph's data */
IF v_chart_data = '' THEN
SET v_chart_data = ROUND(v_data_length_sum / v_data_length_total, 2) * 100;
ELSE
SET v_chart_data = concat(v_chart_data, ',', ROUND(v_data_length_sum / v_data_length_total, 2) * 100);
END IF;
END LOOP get_data;
/* Close the cursor */
CLOSE c_schema_sizes;
/* Build up the google graph url */
SET v_url = 'http://chart.apis.google.com/chart?';
SET v_url = CONCAT(v_url, 'cht=', p_chart_type);
SET v_url = CONCAT(v_url, '&chs=', p_width , 'x', p_height);
SET v_url = CONCAT(v_url, '&chtt=Database Sizes (MB)');
SET v_url = CONCAT(v_url, '&chl=', v_chart_labels);
SET v_url = CONCAT(v_url, '&chd=t:', v_chart_data);
SET v_url = CONCAT(v_url, '&chdl=', v_legend_labels);
/* return the url as the function's result */
RETURN v_url;
END$$
DELIMITER ; 

MySQL DB Pie Graph

pChart: gráficas mediante PHP

pChart es una clase PHP que nos ayuda a crear gráficas. Los datos que se muestran se recuperan de sentencias SQL, ficheros CSV o simplemente introduciéndolos de forma manual.
pchart.png
Permite realizar gráficas de líneas, barras y circulares. Su uso es bastante sencillo. Incluso permite añadir ficheros de esquemas de colores.
pChart

Bluff: gráficas mediante Javascript

Bluff es un script que nos permite realizar gráficas de forma sencilla en Javascript. Es necesario incluir la librería JS.Class para que simule canvas en IE.

canvas.png

Crear gráficas es muy sencillo y solo deberemos incluir un script parecido a este:

<canvas id="example"></canvas>
<script type="text/javascript">
var g = new Bluff.Line('example', 400);
g.theme_37signals();
g.title = 'My Graph';
g.data('Apples', [1, 2, 3, 4, 4, 3]);
g.data('Oranges', [4, 8, 7, 9, 8, 9]);
g.data('Watermelon', [2, 3, 1, 5, 6, 8]);
g.data('Peaches', [9, 9, 10, 8, 7, 9]);
g.labels = {0: '2003', 2: '2004', 4: '2005'};
g.draw();
</script>

Bluff

JIT: JavaScript Information Visualization Toolkit

Impresionante la librería que ha creado Nicolas Garcia Belmonte que permite crear gráficas RGraph, Treemaps o Hyperbolic Trees. ¿Y qué tipo de gráficas son estas? pues explicándolo llanamente, las que muestran relación entre elementos usándo árboles, pero algo más visuales, centrando nodos.
jit.png
Por lo poco que he visto, está desarrollado en Canvas y para IE lo simula mediante VML. También estaría bien mirar si permite ampliar nodos dinámicamente.
JIT