Impresionante la librería que ha creado Nicolas Garcia Belmonte que permite crear gráficas RGraph, Treemaps o Hyperbolic Trees. ¿Y qué tipo de gráficas son estas? pues explicándolo llanamente, las que muestran relación entre elementos usándo árboles, pero algo más visuales, centrando nodos.
Por lo poco que he visto, está desarrollado en Canvas y para IE lo simula mediante VML. También estaría bien mirar si permite ampliar nodos dinámicamente. JIT
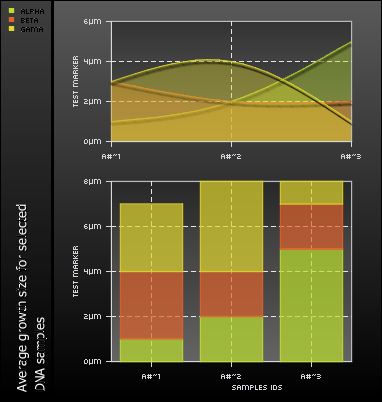
pChart es una clase PHP que nos ayuda a crear gráficas. Los datos que se muestran se recuperan de sentencias SQL, ficheros CSV o simplemente introduciéndolos de forma manual.
Permite realizar gráficas de líneas, barras y circulares. Su uso es bastante sencillo. Incluso permite añadir ficheros de esquemas de colores. pChart
Últimamente hablo mucho de jQuery, y no es para menos, ya que este framework de Javascript es muy bueno y la gente realiza grandes plugins que nos ayudan en nuestros desarrollos. En este caso se trata de varios consejos que nos serán muy útiles a la hora de desarrollar:
Carga la librería desde Google Code
Almacena en variables los selectors que vayas a usar en varias ocasiones
Evita la manipulación DOM lo máximo que puedas, es mejor realizar una llamada “gorda” que varias pequeñas
Usa preferiblemente IDs en vez de nombres de clase cuando realices búsquedas
Realiza la captura de eventos correctamente, muchas capturas suele ser ineficiente
Usa los nombres de clase para guardar el estado de un objeto
Incluso mejor que el anterior, usa el método data() para guardar datos en un objeto
Aprende a crear tus propios selectores
Usa noConflict() para renombrar el objeto jQuery y no tener problemas con otras librerías
Aprende a controlar cuando se cargan las imágenes
Usa .lenght en un selector para saber si un objeto existe
Como ya dije, esta aplicación estará basada en Mongodb, y usaremos mongoose como ODM.
El primer paso es instalar mongoose:
npm i mongoose
Una vez instalado crearemos un controlador que nos permita usar la BD en toda la aplicación Hapi.js. Para ello haremos uso de los decorate del servidor. Los decorations permite extender objectos ofrecidos por Hapi.js, en nuestro caso server y request. Usando un plugin nos conectaremos a mongodb usando mongoose y añadiremos ese objecto con los decorate.
Creamos el fichero /plugins/db.js con el siguiente código:
/**
* DB controller
*
* It uses Mongoose and "stores" it in the server and the request using `decorate`
*/const mongoose = require( 'mongoose' );
exports.plugin = {
name: 'db',
register: asyncfunction( server, options ) {
mongoose.connect( options.url, { useNewUrlParser: true } );
const db = mongoose.connection;
// eslint-disable-next-line
db.on( 'error', console.error.bind( console, 'connection error:' ) );
db.once( 'open', function() {
server.decorate( 'server', 'db', mongoose );
server.decorate( 'request', 'db', mongoose );
// eslint-disable-next-lineconsole.log( 'DB connected' );
} );
},
};
Para configurar la conectividad a mongodb tendremos que añadir los datos a la /config/index.js
Ya tenemos casi todo configurado, ahora vamos a empezar con un ejemplo creando un esquema de moongose que nos permite acceder a colecciones de mongodb.
Lo más común es tener una colección de usuarios, que tendrá los siguientes campos:
userName: de tipo String,
firstName: de tipo String,
lastName: de tipo String,
email: de tipo String,
role: que referencia a otro elemento de otra colección,
isEnabled: de tipo Boolean,
password: de tipo String,
resetPassword: un objeto representado por:
hash: de tipo String,
active: de tipo Boolean,
También crearemos un método estático que devuelva todos los elementos de la colección users para realizar pruebas:
/**
* User model based on Mongoose
*/const mongoose = require( 'mongoose' );
const Schema = mongoose.Schema;
// Mongoose schemaconst userSchema = new mongoose.Schema( {
userName: String,
firstName: String,
lastName: String,
email: String,
role: Schema.Types.ObjectId,
isEnabled: Boolean,
password: String,
resetPassword: {
hash: String,
active: Boolean,
},
} );
/**
* User static model findAll
*
* @returns {array}
*/
userSchema.static( 'findAll', asyncfunction() {
const result = awaitnewPromise( ( resolve, reject ) => {
this.model( 'User' ).find( {} ).exec( ( error, data ) => {
if ( error ) {
reject( error );
}
resolve( data );
} );
} );
return result;
} );
const User = mongoose.model( 'User', userSchema );
module.exports = User;
Ya está todo, ahora solo modificamos el handler de la ruta home.js para mostrar los valores de findAll:
PHP.JS es un script que quiere mover las funciones PHP a Javascript, para que el desarrollador use la misma nomenclatura, ya que hay funciones muy similares y que para desarrolladores poco experimentados puede resultarles confuso.
Yo recomiendo que la gente aprenda ambos lenguajes y que los sepa diferenciar, pero ante la confusión de lenguajes puedes echar mano a este script, aunque de rendimiento puede ir peor.
Entre las funciones nos encontramos las que tratan los arrays, strings, UTF-8, entre otras. PHP.JS
Vía / dzone
You’ve been seeing it for a while now with Google’s Reader, Gmail, and most recently, on Facebook. Probably, you, too, would like to write RESTful evented JavaScript applications. Well, fellow developers, meet Sammy.js, a tiny JavaScript framework built on top of jQuery. Sammy utilizes the URL hash (#) to allow you to create single page AJAX applic …
PHP-Ext es una librería open source que nos permite potenciar la capa UI de Javascript en nuestras aplicaciones. Para ello nos ofrece una serie de librerías (compatibles con PHP 4 y 5) para integrar Ext JS en nuestro sistema. Funciona como un mapeado en clases de la librería JS.
Entre las posibilidades que ofrece nos encontramos con la creación de formularios, combos, grids o menus. A parte ayuda a la comunicación entre el cliente y el servidor mediante JSON y XML.